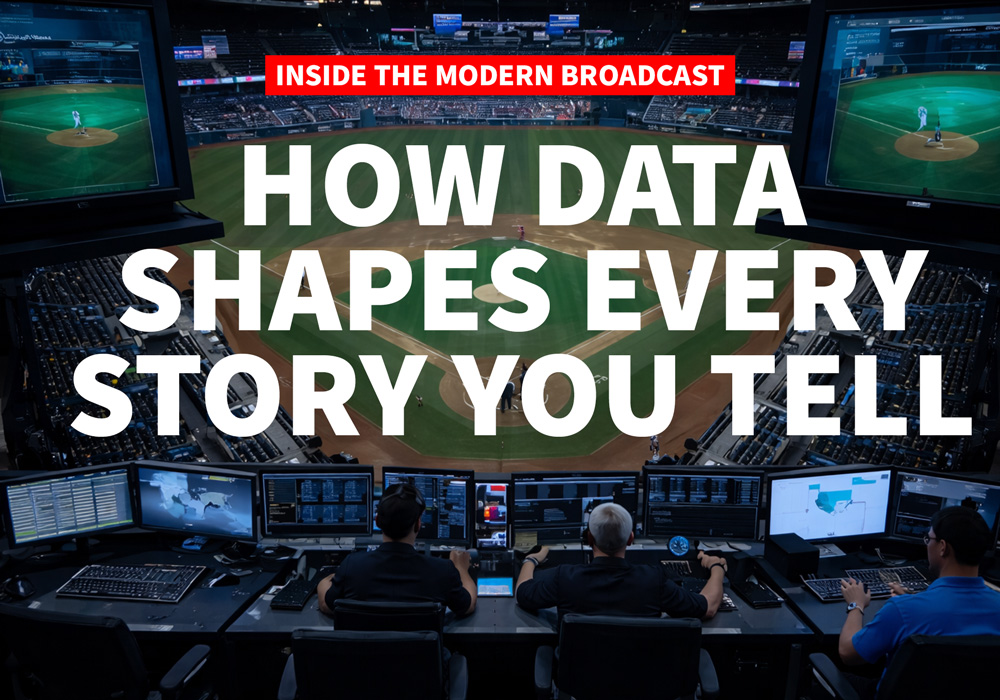
The modern baseball broadcast is about more than showing the game — it’s about explaining it.
Fans want to know why a moment happened, not just that it did. The difference between a good broadcast and a great one often comes down to one thing: Context.
That’s why more than 25 MLB broadcasting teams rely on Sportradar — turning live data into storytelling power that deepens fan connection in real time.
When a closer paints the corner with a 99-mph fastball, it’s more than just velocity — it’s narrative.
Sportradar’s deep historical and live datasets let your production team put key moments in context instantly:
That’s the kind of insight that keeps fans engaged — because they’re not just watching baseball; they’re understanding it.
2025 Example: Jackson Holliday’s breakout start
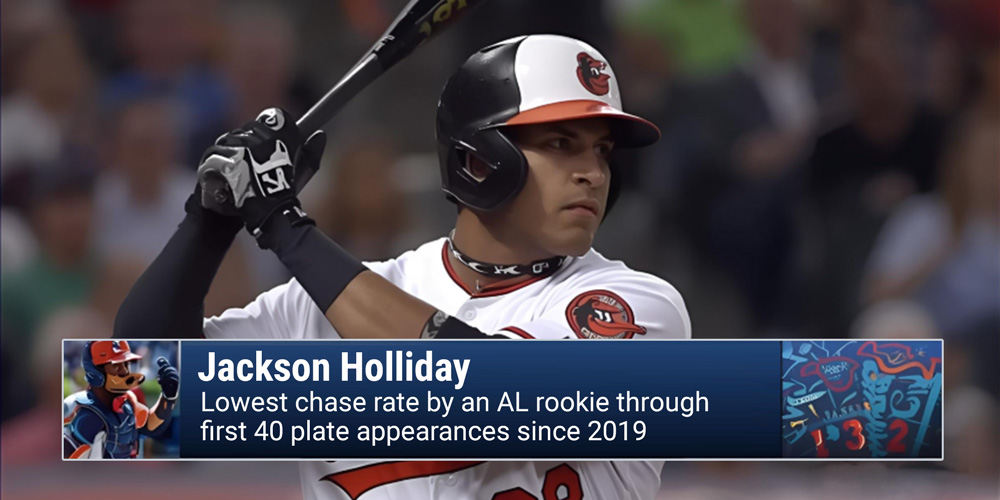
Early in the 2025 season, Jackson Holliday’s plate discipline became a top storyline. In an April 11 broadcast, a Sportradar-powered graphic instantly surfaced:
“Holliday: Lowest chase rate by an AL rookie through first 40 plate appearances since 2019.”
That turned a routine double into a deeper narrative about maturity, approach, and early-season growth — all delivered in real time.
Across the league, broadcasters use Sportradar data this way to build smarter storylines around matchups, defensive alignments, and emerging trends — all surfaced straight from our APIs and research tools.
Live production leaves no time for digging through stats or building graphics from scratch. Sportradar’s real-time data integrates directly into broadcast graphics systems, research tools, and on-demand support teams — giving on-air talent instant access to the “why now” insights that keep fans watching.
Think: a real-time graphic that updates a hitter’s expected batting average after every pitch, or a replay enriched with pitch-movement overlays from earlier innings.
2025 Example: Yamamoto’s redesigned splitter
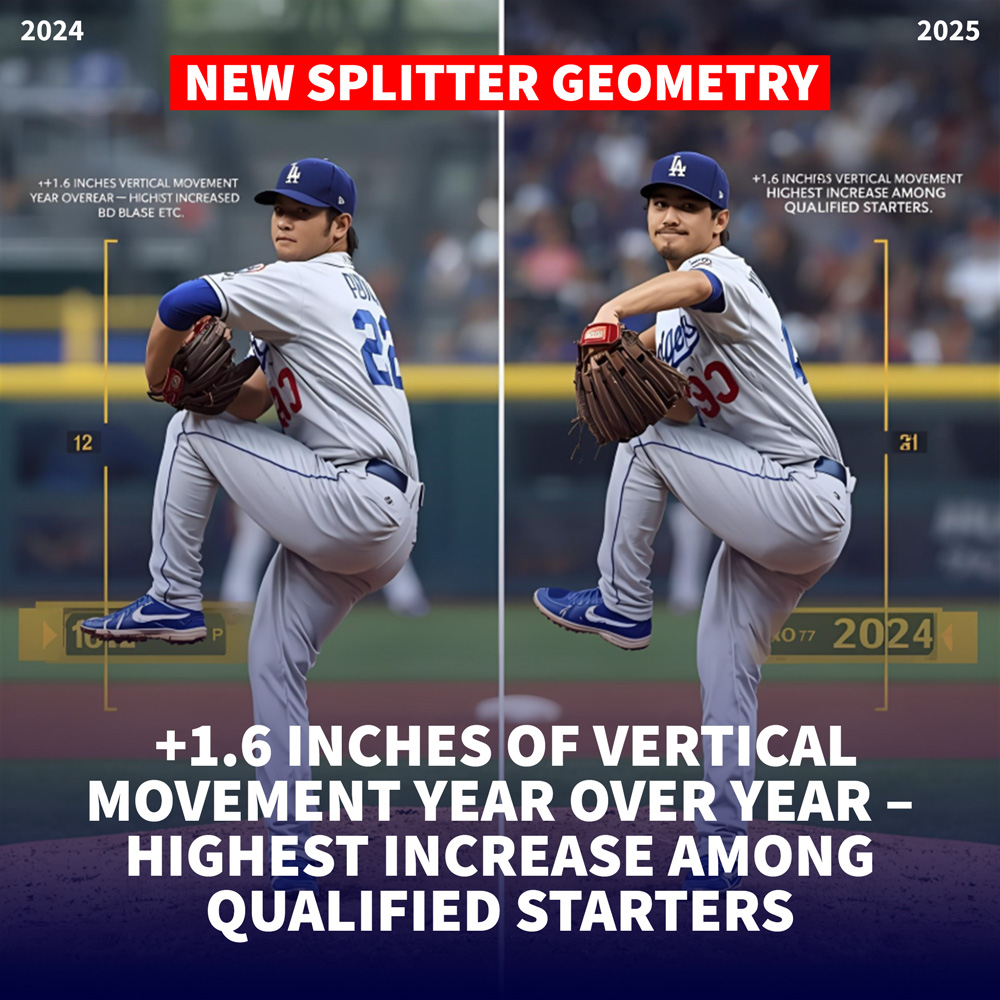
During Yoshinobu Yamamoto’s April 7 start, broadcasters used Sportradar’s live pitch-shape feed to trigger enhanced replays showing:
“New splitter geometry: +1.6 inches of vertical movement year over year — highest increase among qualified starters.”
Analysts were able to explain, in the moment, why hitters were struggling — transforming a dominant outing into a clear, data-backed story.
That’s data in motion — powering sharper analysis, richer storytelling, and more engaging broadcasts without adding extra steps behind the scenes.
Today’s broadcasts are built for multi-screen consumption. Sportradar’s insights help graphics, replay packages, and digital extensions mirror that reality — extending data-driven context from the primary broadcast feed to companion apps and social content.
Broadcasters use our real-time player and team feeds to power interactive visualizations like live spray charts, pitch-location maps, and lineup tendencies — adding depth to every segment, inning, and storyline.
What makes a broadcast feel modern isn’t just the camera work — it’s the intelligence underneath.
Sportradar’s automated trend detection and predictive analytics identify key shifts before they become storylines, helping producers surface the right moments faster.
2025 Example: Elly De La Cruz’s top-speed moment
On April 6, Elly De La Cruz scored from first on a gap-shot double. Within seconds, Sportradar’s tracking system populated an on-air metric:
“Elly hit 31.1 ft/s — fastest first-to-home time of the 2025 season so far.”
Instead of simply calling it “elite speed,” the broadcast turned it into a league-leading moment grounded in real-time data.
That’s the difference between calling the game and owning the moment.
At its best, baseball broadcasting is equal parts analysis and art. Sportradar exists at that intersection — giving broadcasters the tools to make every story sharper, faster, and more connected.
Because the future of baseball storytelling isn’t about replacing instinct with stats.
It’s about using data to make every instinct hit harder.