Three Deep-Dive Ways to Stand Out with Synergy Basketball APIs
The Synergy Basketball API is more than a stats feed—it’s a storytelling engine made for digital-first newsrooms and broadcasts. Here are three distinctive ways to turn advanced basketball data into unforgettable moments for your audience—each designed to set your coverage apart.
1. Play Type Evolution: Tracking Tactical Shifts Over Time
What You Can Do:
Uncover how a team’s offensive identity evolves over the course of a season, highlighting tactical shifts long before they appear in basic stats. For example, track when a team transitions from favoring mid-court transition threes and twos to relying more heavily on pull-up transition threes only.
Why This Makes You Stand Out:
Most outlets stick to results and recaps. By highlighting when and how a team reinvents its attack, you deliver coaching-level insight. Fans get to see strategy unfold—offering an edge few platforms can match.
How Can You Show This Content?
![]()
2. Shot Chart Storytelling: Unmasking Player Superpowers
What You Can Do:
Go beyond generic shot charts by connecting a player’s best moves to specific court locations, play types, and contexts. Using Synergy data, show precisely where unique skills shine—like who’s leading the league in non-corner threes, or which defender shuts down the paint on cuts.
Why This Makes You Stand Out:
You unveil trends and talents that shift narratives—fans see more than “hot zones”; they see the how and why behind player success, giving your coverage breakout potential on social and in analysis.
How Can You Show This Content?
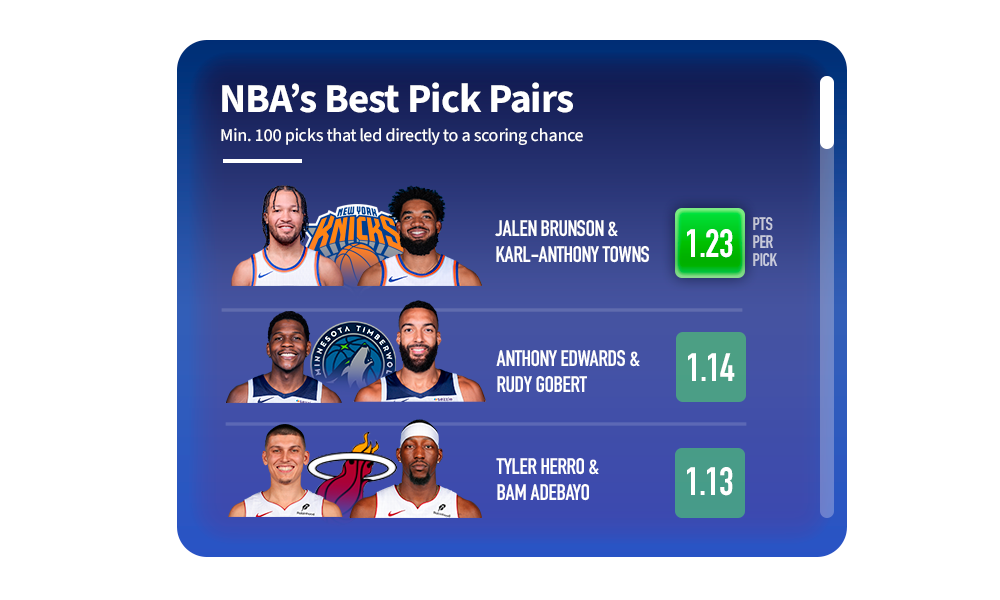
3. Pick-and-Roll Pairs: The Hidden Engine of Scoring Efficiency
What You Can Do:
Use Synergy’s play-type data to spotlight which ball-handler/screener duos drive the most efficient scoring possessions—and how their chemistry shifts depending on opponent, game flow, or lineup context.
Why This Makes You Stand Out:
Most coverage highlights the volume scorers or the star playmakers. Your content goes deeper by showing which pairs actually generate the highest-value shots, turning attention to the synergy between players that fuels offensive efficiency.
How Can You Show This Content?
Takeaway for Media Synergy Basketball APIs let you transform advanced analytics into visually addictive, easily shareable, and truly interactive content—the kind of coverage that not only explains the game, but shows it in a way no one else can.